This page describes how simple acid-base indicators work, and how to choose the right one for a particular titration.
How simple indicators work
Indicators as weak acids
Litmus
Litmus is a weak acid. It has a seriously complicated molecule which we will simplify to HLit. The "H" is the proton which can be given away to something else. The "Lit" is the rest of the weak acid molecule.
There will be an equilibrium established when this acid dissolves in water. Taking the simplified version of this equilibrium:
The un-ionised litmus is red, whereas the ion is blue.
Now use Le Chatelier's Principle to work out what would happen if you added hydroxide ions or some more hydrogen ions to this equilibrium.
Adding hydroxide ions:
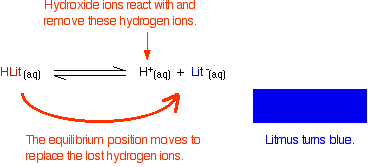
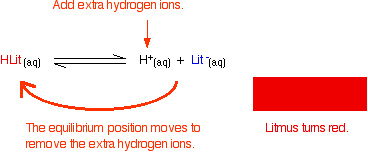
At some point during the movement of the position of equilibrium, the concentrations of the two colours will become equal. The colour you see will be a mixture of the two.

Methyl orange
Methyl orange is one of the indicators commonly used in titrations. In an alkaline solution, methyl orange is yellow and the structure is:

In fact, the hydrogen ion attaches to one of the nitrogens in the nitrogen-nitrogen double bond to give a structure which might be drawn like this:
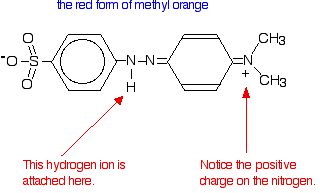
You have the same sort of equilibrium between the two forms of methyl orange as in the litmus case - but the colours are different.
In the methyl orange case, the half-way stage where the mixture of red and yellow produces an orange colour happens at pH 3.7 - nowhere near neutral. This will be explored further down this page.
Phenolphthalein
Phenolphthalein is another commonly used indicator for titrations, and is another weak acid.
The half-way stage happens at pH 9.3. Since a mixture of pink and colourless is simply a paler pink, this is difficult to detect with any accuracy!
The pH range of indicators
The importance of pKind
Think about a general indicator, HInd - where "Ind" is all the rest of the indicator apart from the hydrogen ion which is given away:
Because this is just like any other weak acid, you can write an expression for Ka for it. We will call it Kind to stress that we are talking about the indicator.

Think of what happens half-way through the colour change. At this point the concentrations of the acid and its ion are equal. In that case, they will cancel out of the Kind expression.


| indicator | pKind |
|---|---|
| litmus | 6.5 |
| methyl orange | 3.7 |
| phenolphthalein | 9.3 |
Indicators don't change colour sharply at one particular pH (given by their pKind). Instead, they change over a narrow range of pH.
Assume the equilibrium is firmly to one side, but now you add something to start to shift it. As the equilibrium shifts, you will start to get more and more of the second colour formed, and at some point the eye will start to detect it.
For example, suppose you had methyl orange in an alkaline solution so that the dominant colour was yellow. Now start to add acid so that the equilibrium begins to shift.
At some point there will be enough of the red form of the methyl orange present that the solution will begin to take on an orange tint. As you go on adding more acid, the red will eventually become so dominant that you can no longe see any yellow.
There is a gradual smooth change from one colour to the other, taking place over a range of pH. As a rough "rule of thumb", the visible change takes place about 1 pH unit either side of the pKind value.
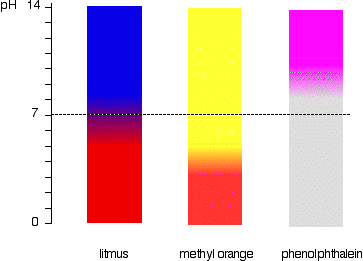
The exact values for the three indicators we've looked at are:
| indicator | pKind | pH range |
|---|---|---|
| litmus | 6.5 | 5 - 8 |
| methyl orange | 3.7 | 3.1 - 4.4 |
| phenolphthalein | 9.3 | 8.3 - 10.0 |
This is more easily seen diagramatically.
Choosing indicators for titrations
Remember that the equivalence point of a titration is where you have mixed the two substances in exactly equation proportions. You obviously need to choose an indicator which changes colour as close as possible to that equivalence point. That varies from titration to titration.
Strong acid v strong base
The next diagram shows the pH curve for adding a strong acid to a strong base. Superimposed on it are the pH ranges for methyl orange and phenolphthalein.
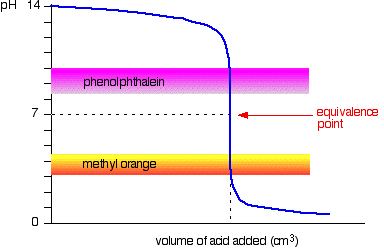
However, the graph is so steep at that point that there will be virtually no difference in the volume of acid added whichever indicator you choose. However, it would make sense to titrate to the best possible colour with each indicator.
If you use phenolphthalein, you would titrate until it just becomes colourless (at pH 8.3) because that is as close as you can get to the equivalence point.
On the other hand, using methyl orange, you would titrate until there is the very first trace of orange in the solution. If the solution becomes red, you are getting further from the equivalence point.
Strong acid v weak base
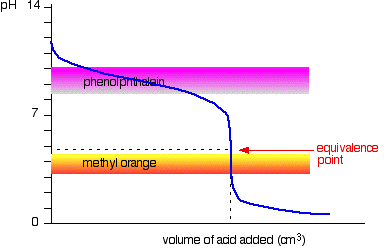
You have to choose an indicator which changes colour on the steep bit of the curve.
Weak acid v strong base
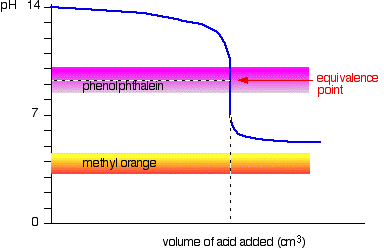
Weak acid v weak base
The curve is for a case where the acid and base are both equally weak - for example, ethanoic acid and ammonia solution. In other cases, the equivalence point will be at some other pH.
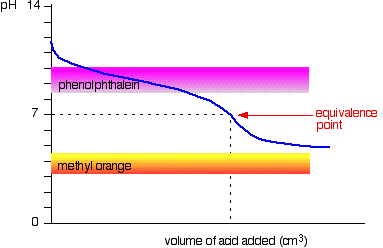
It may be possible to find an indicator which starts to change or finishes changing at the equivalence point, but because the pH of the equivalence point will be different from case to case, you can't generalise.
On the whole, you would never titrate a weak acid and a weak base in the presence of an indicator.
Sodium carbonate solution and dilute hydrochloric acid
This is an interesting special case. If you use phenolphthalein or methyl orange, both will give a valid titration result - but the value with phenolphthalein will be exactly half the methyl orange one.
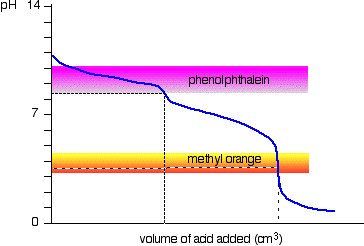
The methyl orange changes colour at exactly the pH of the equivalence point of the second stage of the reaction.
No comments:
Post a Comment